
96.9 GW of Solar and 21.7 GW of Wind Capacity affected by curtailment in September 2026
In September 2026, 378.52 MUs of variable renewable energy were curtailed, equivalent to 1.28% of total renewable energy generation, highlighting ongoing grid integration challenges. A total of 118.6 GW* of renewable energy capacity was affected by curtailment during the month, comprising 96.9 GW of solar and 21.7 GW of wind capacity.
Key reasons for RE curtailment include demand-generation mismatches, transmission constraints, limited storage and grid flexibility, and seasonal overlaps between high renewable output and moderate demand.
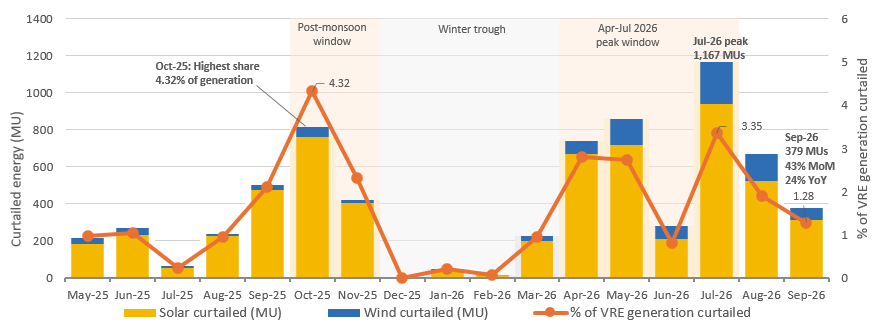
Figure 1. Monthly Variable Renewable Energy (VRE) curtailment in India, May 2025 to September 2026
Source: Grid-India, JMK Research & Analytics
- Year-on-year increase: Curtailment rose sharply from May to August 2026, reaching nearly four times the level recorded in the same period of 2025. The addition of around 44.6 GW of solar capacity in FY2026 has increased pressure on transmission infrastructure and grid flexibility.
- Wind curtailment is rising: Solar accounted for 83% of September 2026 curtailment, at around 314 MUs. However, wind curtailment nearly tripled year on year to 64.98 MUs, increasing its share of total curtailment from 4.7% to 17%.
- Seasonal fluctuations: Curtailment remained below 50 MUs per month during December-February but increased from April 2026, peaking at 1,166.52 MUs in July. October 2025 recorded the highest curtailment share at 4.32% of generation.
- September reprieve amid rising curtailment: Curtailment fell 43.31% month on month to 378.52 MUs in September 2026, down 24% from September 2025. The share of generation curtailed also declined by 0.61 percentage points, from 1.89% in August to 1.28% in September. However, this decline offers seasonal relief rather than evidence of a structural improvement in grid integration.
Real-time system constraints vs Emergency Tertiary Reserve Ancillary Services (TRAS) Down
Grid-India classifies VRE curtailment into two categories based on the operational instructions issued:
- Real-time system constraints: Real-time constraints are back-down instructions issued on the day to manage congestion and operating limits.
- Emergency TRAS Down: TRAS Down involves reducing generation to balance supply and demand. Its use for VRE indicates limited flexibility in the power system to accommodate available renewable generation.
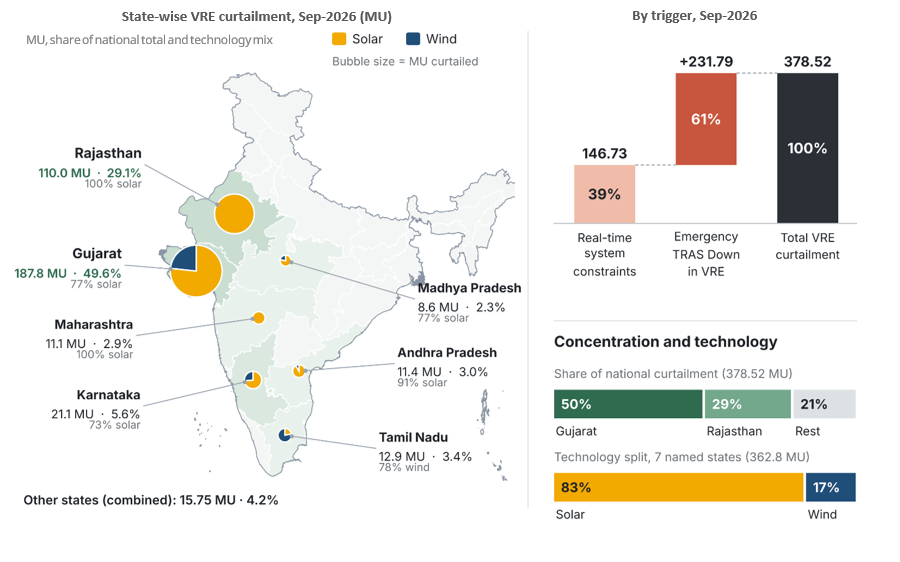
Of September’s curtailment, 146.73 MUs (39%) was due to real-time system constraints and 231.79 MUs (61%) was due to Emergency TRAS Down in VRE. Solar accounted for about 82% of the energy curtailed through TRAS Down. This suggests that September’s curtailment was driven mainly by the need to balance the power system, rather than by grid congestion alone.
Figure 2. State-wise VRE curtailment and curtailment by trigger, September 2026
Source: Grid-India, JMK Research & Analytics
Gujarat (187.76 MUs, 49.6%) and Rajasthan (110 MUs, 29.1%) together accounted for around 79% of the total curtailment. Gujarat alone contributed about two-thirds of wind curtailment (43.75 MUs), while Rajasthan’s curtailment was entirely solar. Karnataka and Tamil Nadu recorded technology-wise differences in curtailment, totalling 21.07 MUs and 12.93 MUs, respectively. Solar accounted for a larger share in Karnataka, whereas wind contributed more significantly to Tamil Nadu.
Battery energy storage systems (BESS) can reduce curtailment by storing surplus renewable energy during midday and discharging it during evening peaks. September’s 378.52 MUs of curtailment equates to an average of 12.6 GWh per day, or roughly 3 GW of 4-hour storage as an illustrative scale estimate.
- Prioritising constrained nodes in Gujarat and Rajasthan, with storage sized to recurring surpluses and responsive to system operator signals, could also help absorb emergency downward reserves (TRAS Down) events.
- Storage could complement transmission upgrades, flexible thermal generation, improved forecasting, demand shifting and markets that reward flexibility.
- Further renewable energy installations are likely to increase the need for solutions to manage seasonal and location-specific curtailment. Strategically sited and co-located BESS can help limit renewable energy losses and protect project revenues.
*Cumulative sum of daily real-time and TRAS Down curtailed capacity (MW) as reported by Grid-India. It is not capacity affected at a single point in time.
Note: Days with no published data are treated as zero curtailment in MU totals. Descriptions of real-time constraints and TRAS Down are JMK’s interpretation, as Grid-India does not publish formal definitions. State data covers seven states; the remaining 15.75 MU is shown as “Other states”.
Source: Grid-India; JMK Research & Analytics