
Solar projects installation trends in FY 2019 – Third party sale
In FY 2019, about 270 MW of third party sale/ Open access (OA) solar projects are installed which is 83% lesser than previous year installation (1,685 MW). In FY 2018, about 86% of total OA solar projects (1,450 MW) were installed in Karnataka only. Reason for this are the waivers offered on most open access charges (including transmission and wheeling charges, CSS charges) in Karnataka until March 31, 2018. These waivers were instrumental in accelerating the growth of Open access solar market in Karnataka however the local government did not extend it beyond the March 31, 2018 deadline.
Therefore in FY2019, of all OA installations only 29% (80 MW) were installed in Karnataka which is y-o-y fall of about 94%. Other major OA installations in FY2019 were in Maharashtra, Madhya Pradesh and Rajasthan.
Figure 1.1: Third party sale/ OA solar projects installation trends, MW
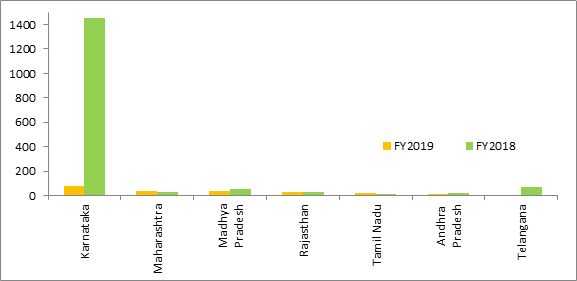
Source: BRIDGE TO INDIA, JMK Research
These installations were mainly by mid-size regional players focused only on states where they have easier access to land and have favorable open access policies. For example, Ujaas is developing solar parks exclusively in Madhya Pradesh with more than 150 MW in total capacity. Similarly Rays Power Experts has projects at multiple locations in Rajasthan. Enrich is focusing on Maharashtra. Ujaas, Enrich and Rays Experts are old players which from last 4-5 years are developing projects under this model in their specific focus states.
ReNew, CleanMax and Amplus are new additions to this list which have started building OA solar projects in last two years only. Renew has built about 200 MW of OA projects in Karnataka only in FY2018. CleanMax has built about 224 MW OA projects in Karnataka, 22 MW in Tamil Nadu and has further plans to build 150 MW in Haryana under group captive model. Amplus has a total portfolio of 220 MW of OA projects in Karnataka only. It also plans to have another 150 MW OA project in Haryana with a capital investment of ₹7.5 billion.
Figure 1.2: Player wise installation trends for third party sale/ Open access solar projects, as of March 31, 2019
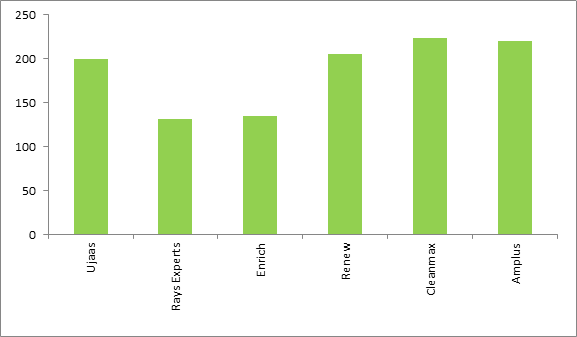
Source: BRIDGE TO INDIA, KREDL, JMK Research